Playcraft ATCC
Automatic traffic counting and classification from footage you already have: CCTV, drone or a phone on a pole. No roadside hardware, no per-kilometre fee, and the footage never leaves your building.
Divided carriageway, both directions
26 JUL 2025 · 06:15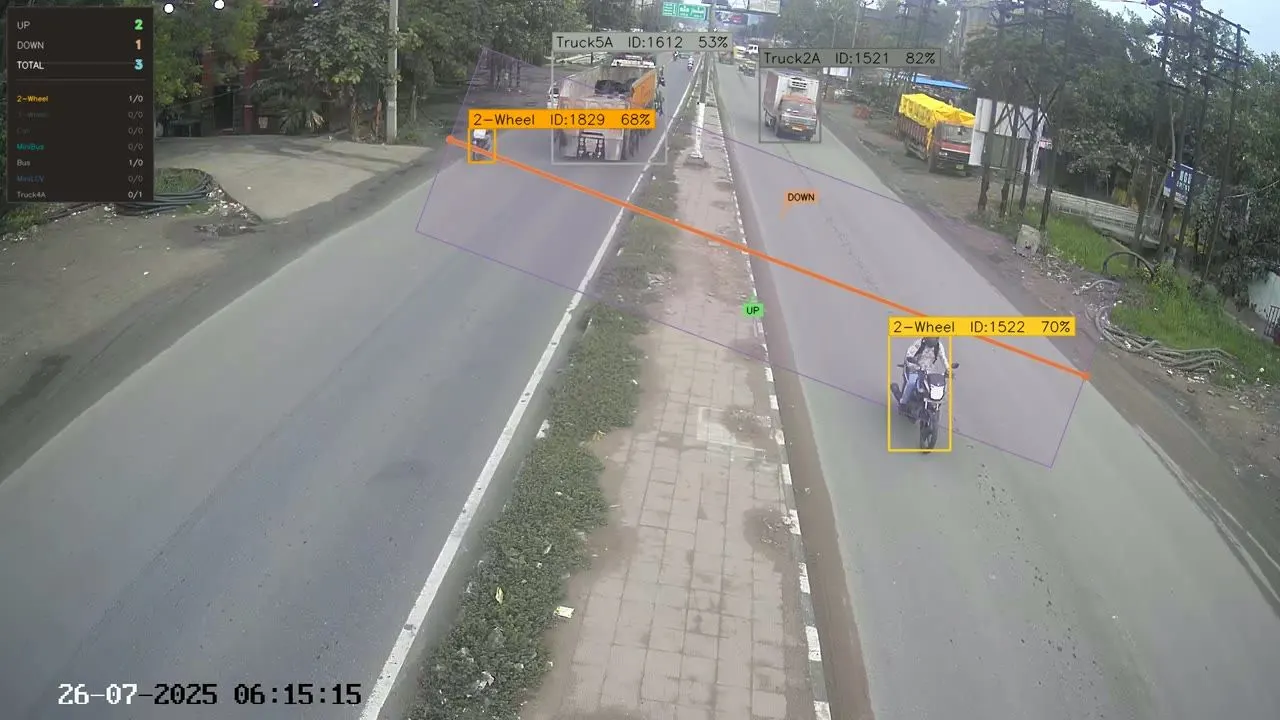
- Runs on
- Windows desktop · offline
- Input
- CCTV, drone or phone-on-pole video
- Primary output
- Classified volume count with PCU, per-vehicle log and verification video
- Licence
- Machine-bound, verified offline
Back within a working day: the classified count, the annotated verification video, and where your camera position is costing you. You keep the output.
Seen running
What it looks like on real roads
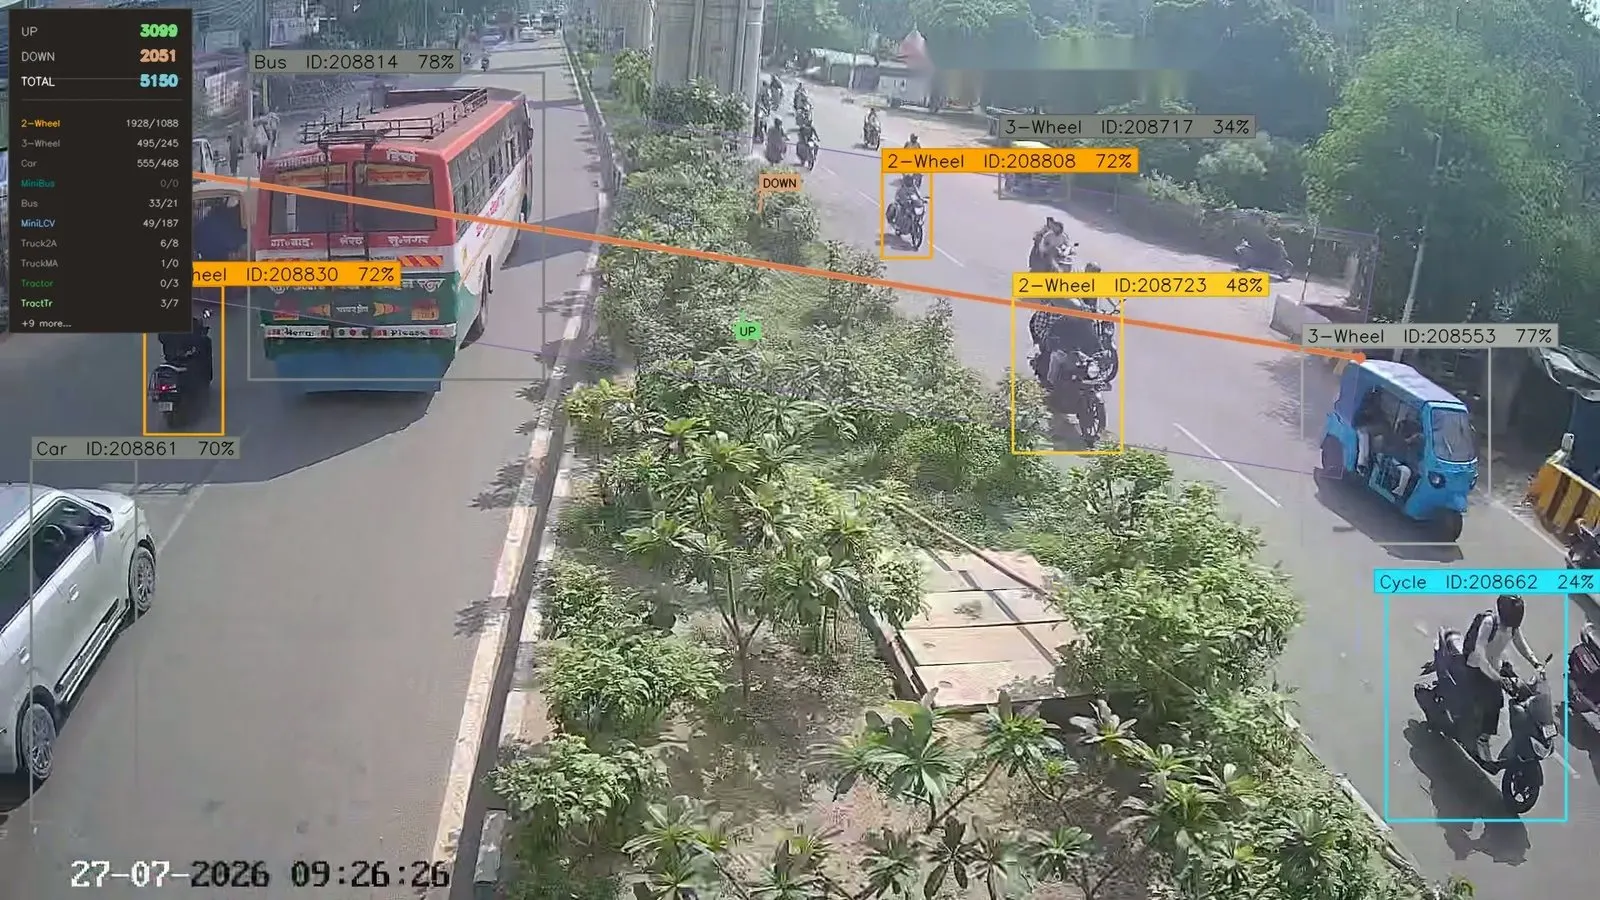
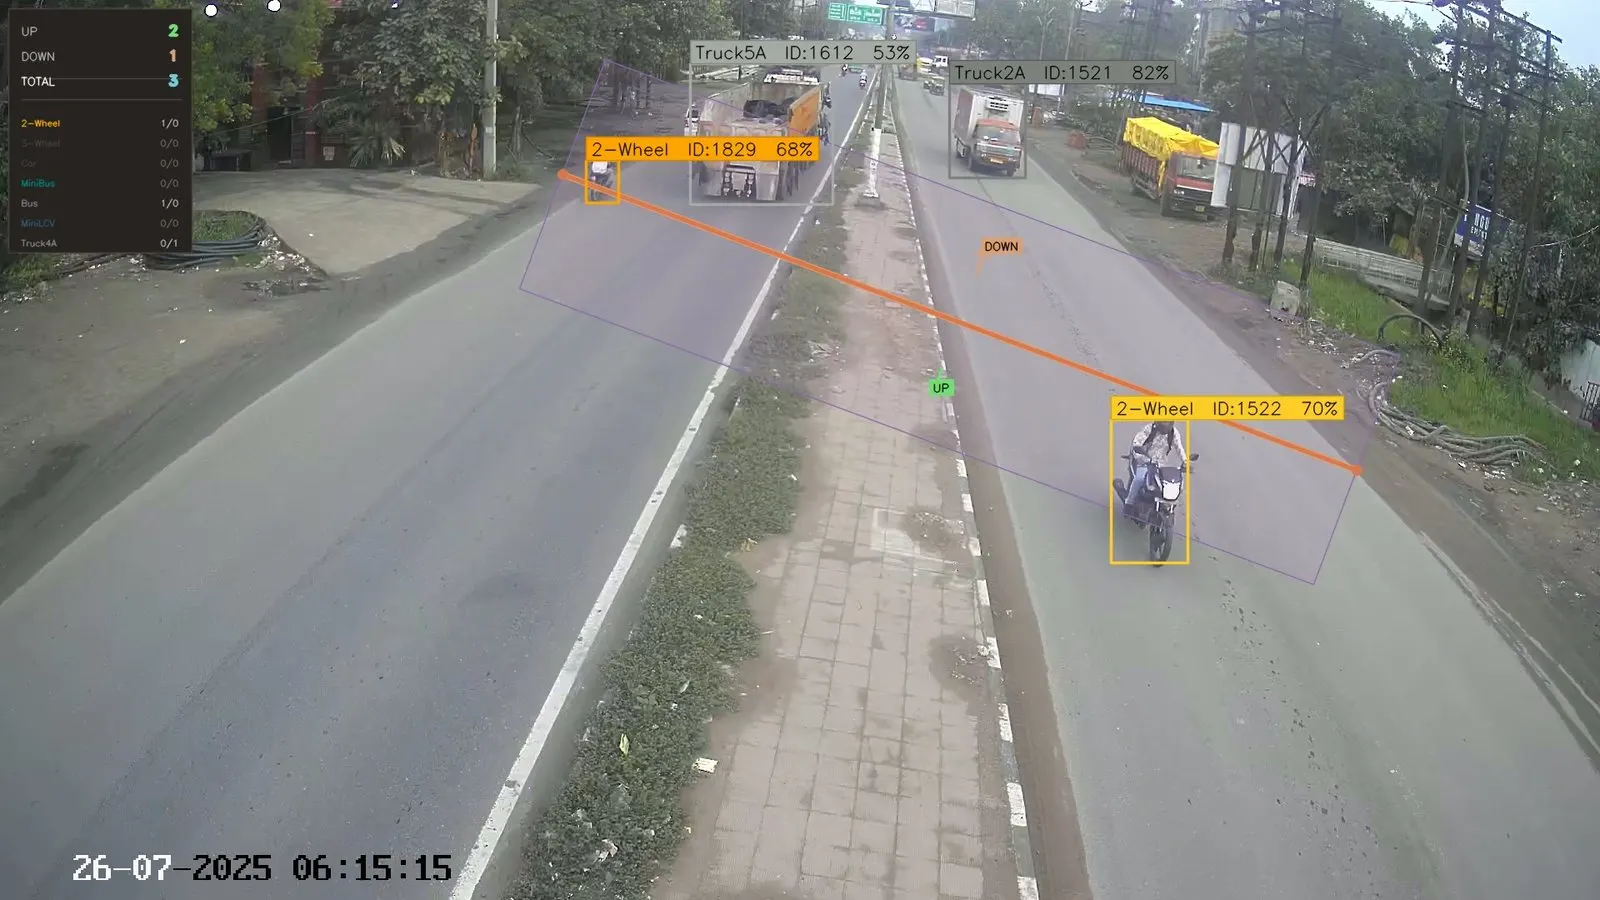
Clips and frames from production surveys. Not staged, not rendered for this page. Play them and watch the counters move as each vehicle crosses.
Five-axle articulated truck
10 JUL 2025 · 09:43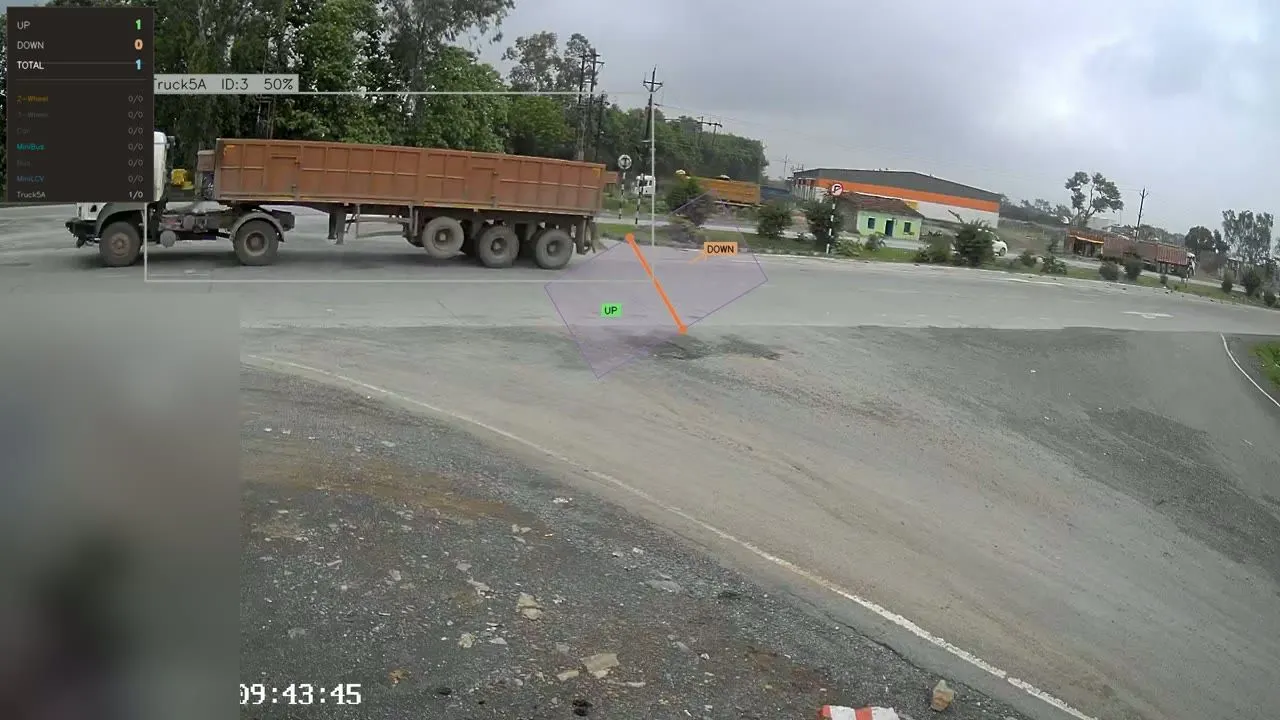
The class that is easiest to get wrong
Five seconds at a junction. The class that is easiest to get wrong lands in the right column, and the tally shows it.
Specification
What it does, how it arrives, what you get back
Capabilities
- 18 vehicle categories plus an Other bucket, following IRC/MoRTH survey convention; the current model has no class for articulated trucks or cycle rickshaws
- PCU conversion per IRC:64-1990; another schedule, such as IRC:106-1990 for urban roads, is set up on request
- Directional counts in 15-minute intervals; an hour is four rows added together
- Per-vehicle log — any interval reconciles back to the source frame
- Counting line placed visually on a reference frame, in two clicks
Delivery
- Offline desktop application for Windows
- Machine-bound licence, verified without network access
- One-click install; no portal, no token refresh, no outbound traffic
Outputs
- Classified volume count survey output, both directions and directional split
- PCU summary per IRC:64-1990
- Per-vehicle classified log with timestamps and confidence
- Annotated verification video for manual audit
- CSV files, which open directly in Excel
What you actually receive
The deliverable, from a real survey
Files from the production run behind the published accuracy figures, not illustrative numbers. The total of 4,595 is the same one that appears as Site A in the accuracy table.
Classified volume count
combined.csv| Class | 07390745 | 07450800 | 08000814 | Total |
|---|---|---|---|---|
| Bus | 8 | 30 | 23 | 61 |
| Car/Van/Jeep | 162 | 369 | 393 | 924 |
| 2-Wheeler | 401 | 977 | 1,073 | 2,451 |
| 3-Wheeler | 128 | 353 | 319 | 800 |
| Mini LCV | 34 | 50 | 64 | 148 |
| 2-Axle Truck | 3 | 19 | 17 | 39 |
| Cycle | 20 | 50 | 47 | 117 |
| Total | 769 | 1,869 | 1,957 | 4,595 |
Recording began at 07:39, so the first window is partial (six minutes). The count file labels windows by their actual span; the verification index below aligns the same three windows to the quarter-hour.
PCU summary per IRC:64-1990
pcu_summary.csv| Category | Count | Factor | PCU |
|---|---|---|---|
| Bus | 61 | 3.0 | 183 |
| Mini Bus | 6 | 1.5 | 9 |
| Car / Van / Jeep | 924 | 1.0 | 924 |
| 2-Wheeler | 2,451 | 0.5 | 1,225.5 |
| 3-Wheeler | 800 | 1.0 | 800 |
| Mini LCV | 148 | 1.0 | 148 |
| LCV | 1 | 1.5 | 1.5 |
| 2-Axle Truck | 39 | 3.0 | 117 |
| 3-Axle Truck | 10 | 3.0 | 30 |
| MAV | 16 | 4.5 | 72 |
| Tractor | 6 | 1.5 | 9 |
| Tractor Trailer | 16 | 4.5 | 72 |
| Cycle | 117 | 0.5 | 58.5 |
| Total | 4,595 | 3,649.5 |
Tractor recomputed at 1.5 (IRC:64-1990 Table 1, row 3). The file as delivered applied 4.5, the tractor-trailer factor: 27.0 PCU, 3,667.5 in total.
Count and PCU on one scale
pcu_summary.csvVehicles counted
Passenger car units, IRC:64-1990
Pick a category to follow it across both bars.
Verification index
VERIFICATION.txt| Clock window | Video position | Up | Down | Total |
|---|---|---|---|---|
| 07:30 – 07:45 | 00:00:00 – 00:06:00 | 448 | 321 | 769 |
| 07:45 – 08:00 | 00:06:00 – 00:21:00 | 1,209 | 660 | 1,869 |
| 08:00 – 08:15 | 00:21:00 – 00:36:00 | 1,299 | 658 | 1,957 |
| Total | 2,956 | 1,639 | 4,595 |
Seven rows of the per-vehicle log, replayed at ¼ speed
crossings_audited.csv- UP
- 4
- DOWN
- 3
- TOTAL
- 7
| Class | Up | Down |
|---|---|---|
| Car | ↑ 2 | ↓ 1 |
| 2-Wheeler | ↑ 2 | ↓ 1 |
| 3-Wheeler | ↑ 0 | ↓ 1 |
LAST ROW
07:39:01 00:00:01 track 1 car 0.851 DOWN
Per-vehicle classified log
crossings_audited.csv| Clock | Video pos. | Track | Class | Conf. | Dir. |
|---|---|---|---|---|---|
| 07:39:00 | 00:00:00 | 2 | car | 0.822 | UP |
| 07:39:00 | 00:00:00 | 4 | two_wheeler | 0.627 | UP |
| 07:39:00 | 00:00:00 | 13 | two_wheeler | 0.573 | UP |
| 07:39:00 | 00:00:00 | 10 | three_wheeler | 0.291 | DOWN |
| 07:39:00 | 00:00:00 | 9 | two_wheeler | 0.599 | DOWN |
| 07:39:01 | 00:00:01 | 5 | car | 0.694 | UP |
| 07:39:01 | 00:00:01 | 1 | car | 0.851 | DOWN |
Conf. is the model’s confidence in the class it assigned. Low-confidence rows stay in the file rather than being dropped, so a reviewer can scrub to exactly those crossings.
The verification index is the point. Every clock window maps to a position in the annotated video, so a reviewer can scrub to it, count what crosses, and compare against our figure. The per-vehicle log carries the same pairing on every row. A number you can check is worth more than a number you are asked to trust.
Measured, not claimed
Accuracy, with its method
Every figure here is stated against independent hand counts, and the harder of the two measures is the one we lead with.
Three sites, Indian arterial roads, live uncontrolled traffic
11 August 2026| Site | Vehicles | Accuracy |
|---|---|---|
| A | 4,579 manual4,595 counted | 93.0% weighted99.7% volume |
| B | 5,824 manual5,375 counted | 91.2% weighted92.3% volume |
| C | 6,157 manual5,759 counted | 92.3% weighted93.5% volume |
| All | 16,560 manual15,729 counted | 92.1% weighted95.0% volume |
Manual — hand-counted by an independent survey firm Counted — by the software
We lead with 92.1% weighted, not 95.0% volume. Weighted accuracy asks whether every vehicle landed in the right column. Volume accuracy lets over- and under-counts cancel.
Before you ask
Video ATCC for Indian survey work: what engineers ask first
What footage does it need?
Recorded video at 1080p or above — from CCTV, a drone or a phone on a pole — with a bitrate high enough that small, fast vehicles are not smeared by compression. The camera has to see the full width being counted, ideally from a high mounting with a steep view, with the counting line in the nearer half of the frame.
Can it count from CCTV we already have?
Often, but not always. What decides it is how many pixels a two-wheeler occupies where it crosses the counting line, and most corridor CCTV was not mounted for counting. Fifteen minutes of footage from that camera answers the question.
Which vehicle classes does it count?
The output has 19 class columns — 18 named vehicle categories plus Other — in 15-minute intervals, by direction, with PCU applied per IRC:64-1990. The current model fills 17 of them: it has no class for articulated trucks or cycle rickshaws, so those two columns read zero. Another schedule, such as IRC:106-1990 for urban roads, is set up on request.
How accurate is it?
95.0% by volume and 92.1% by weighted class, measured against 16,560 vehicles counted by hand by an independent survey firm. We lead with the lower figure, because volume accuracy lets over- and under-counts cancel.
Does our footage leave the building?
No. It is an offline Windows application with a machine-bound licence that is verified without network access: no portal, no token refresh, no outbound traffic.
What does it cost?
We do not publish prices, because scope decides the number. What moves it is the licence term (lifetime or annual), how many machines it runs on, and what the deployment needs. There is no per-kilometre fee.
Is there a trial licence?
No. Instead, send us 15 minutes of footage. Back within a working day: the classified count, the annotated verification video, and where your camera position is costing you. You keep the output. Or watch it run on footage of your choice on a call.
Reference
Further reading
Types of traffic survey for a highway DPR
The surveys MoRTH’s DPR terms of reference ask for, with stations, duration, method and output for each, and which of them video can do.
The classified traffic volume count, and what a DPR needs
What the deliverable has to contain, which parts recorded video can produce, and the three surveys it cannot.
How to evaluate an ATCC accuracy claim
Seven questions that turn an accuracy percentage into something you can check, with our own answers to each.
Also available
Other tools
Playcraft Distress
Alligator cracking and potholes found and measured in square metres, from survey video.
Playcraft Chainage
Chainage-stamped survey video and a road roughness estimate, from a phone.
Airport Pavement Platform
Condition management for runways, taxiways and aprons.
Next step
Send us 15 minutes of your footage
- Classified count, per class and per direction
- Annotated verification video
- A note on what your camera position is costing you
No obligation. You keep the output. Back within a working day.